Schematix SSO support via SAML2

By Daniel Evenson, Feb 23, 2021

Schematix users can now be authenticated via your enterprise SSO solution.

Contact support if you would like this configured for your Schematix environment.

New Schematix Features!

By Daniel Evenson, Apr 3, 2019

There are a couple new features to introduce!

  • Unseen relation counts

    You may have noticed some new numbers displayed inside objects. These are the unseen relation counts. When an object is shown without all its relations, those numbers will indicate the number of unseen relations.

    The unseen counts give you a hint of what you're not seeing. To see those relations, simply double-click the object.

    To disable this feature, and get the old behavior, do: set unseen off

  • Diagram panning conservation

    Schematix will now attempt to preserve your panning/centering adjustments to the diagram upon next diagram update. This helps prevent the annoying behavior where the diagram continually recenters itself each time the display is updated.

Microsoft Edge Browser Support

By Daniel Evenson, Apr 10, 2018

Schematix supports all the major web browsers (Firefox, Chrome, Safari, and Internet Explorer), and now Edge as well.

However, older versions of Edge have a bug which Microsoft has now fixed which affects how SVG attributes such as "fill" and "stroke" are handled. If you are using an older version of Edge, you might get a diagram that looks like the following:"

Using Edge version 41.16299.15.0 or higher, that diagram should look like:

New Charts Feature

By Daniel Evenson, Dec 3, 2017

I'm happy to announce a new feature which allows Schematix to display foreign image charts within Schematix diagrams.

This enables you to display, in the context of your diagrams, things like CPU, network statistics, or any other charts or images which pertain the the objects modeled in Schematix.

Schematix doesn't collect the chart data, or make the diagram, it simply requests the chart image via a URL constructed from a user-defined template which incorporates information from the Schematix objects in which the diagram is embedded.

This "charts" feature enables you to use Schematix as a front-end for whatever monitoring system you currently use. It also works nicely with Schematix SaaS since the diagrams are loaded by your browser and not by the Schematix server thus avoiding authentication problems since you'll be accessing your monitoring system from within your own network.

Using Schematix as a front-end to view such statistics is very powerful, because you can now view the statistics in the context of a Schematix diagram. For example, If you are troubleshooting a slow or failing application which depends on many servers distributed throughout your infrastructure, you can see all the relevant servers and their statistics at once, without having to manually poke through your monitoring system's interface to find all the servers which might be involved.

You can exercise this feature with just a couple minutes effort by following the example below.

If you have a monitoring system which generates CPU charts via a URL as follows:

    http://example.com/CPU/servername
You can turn on the display of such charts by doing:
    set chart.cpu.url "http://example.com/URL/${name}"

At this point, each object rendered on your screen will now display an embedded chart generated from a custom URL which ends with the object's name. There are more ways to customize the behavior such as restricting which objects display which charts.

The charts feature is configured via the Admin tab.

To see the command line help regarding charts do:

help charts

Modeling Dataflow Integrations

By Daniel Evenson, Thu Dec 1, 2016

I was recently asked how to model custom integrations which feed data between high-level applications. Here's how to do it using Schematix:

For the sake of simplicity, I used very short object names. Normally they should be more descriptive.

Here we have two high-level applications, e1 and e2. e1 feeds data to e2 via the integration i1.

The integration i1 exists to hold the attributes of owner and schedule and any other high level details you want to record for this particular integration. We can even model which objects this integration depends upon like I have done with the script s1. Perhaps i1 needs other objects as well. Or s1 might need other things. You might have other integrations doing other things with also need this same script s1.

Perhaps e1 needs the data d1, like I have modeled.

If the purpose of integration i1 is to get data from d1 to e2, we model that i1 needs d1.

Let's see if my model is semantically correct by exercising a few common Schematix "views" using the "show" command.


show about i1
This shows all relations directly to and from i1.
It's a good way to render a diagram of i1 to see everything we know about it.

show impact e2
This shows us what would be adversely impacted by a failure of e2.
We see that e1 would be adversely impacted because i1 is adversely impacted.

show deps e1
This shows us the dependencies of e1.
These are all the object which could adversely affect e1 if they were to fail.

Here's a few more show commands which might come in handy as you're modeling such integrations:

    show about *[integration]     Show an "about" diagram of every integration

    show *>>feeds>>*              Show all feeds relations

    show *[integration]
    set collect schedule          Show all integrations, and group them by schedule. 
    

Schematix Automatic Discovery: Microsoft Azure

By Ryan Redman, Jun 9, 2016

As highlighted in a previous post, adoption of cloud-based Infrastructure as a Service (IaaS) is a rapidly growing segment of the modern IT world. Whether attempting to scale out infrastructure, virtualize existing hardware, or rapidly build up a preliminary development platform one will likely find themselves looking at Microsoft's Azure.

Azure focuses on allowing users to create, scale, and migrate their environment on Microsoft managed equipment. Azure does not, however, provide much in the way of aide getting a clear, actionable picture into the state of the system being stored. In fact, users attempting to see how their Azure systems interact with their other hardware will quickly find themselves with a sizable problem; one seemingly without adequate solution.

At Pathway Systems, we understand the advantages offered by moving to IaaS products such as Azure. We are also very aware of the pitfalls users of these services face in fully understanding their environments. Luckily, we have distilled down the process of mapping out the entirety of your Azure environment to just two commands.

An example of an Azure VM synchronized by Schematix

Automatically discovered Microsoft Azure virtual machine.

1. Authenticate Schematix

First, after a Schematix user who manages their team's Azure Active Directory issues the following CML command: :agent azure authenticate That user will be given an HTTP link directing them to an Azure page covering the read permissions required by Schematix, and allowing the import of Pathway Systems Schematix as a permitted application in Active Directory.

2. Fetch Azure Information

Second, after authentication, the azure agent will be used to retrieve information about the Azure subscriptions it's been permitted read access to. This action can subsequently be repeated by running the CML command: :agent azure fetch Output from this command, as with any Schematix agent, can then be written to a file, or piped to Schematix' synchronization commands to be compared against and then merged into the current model.

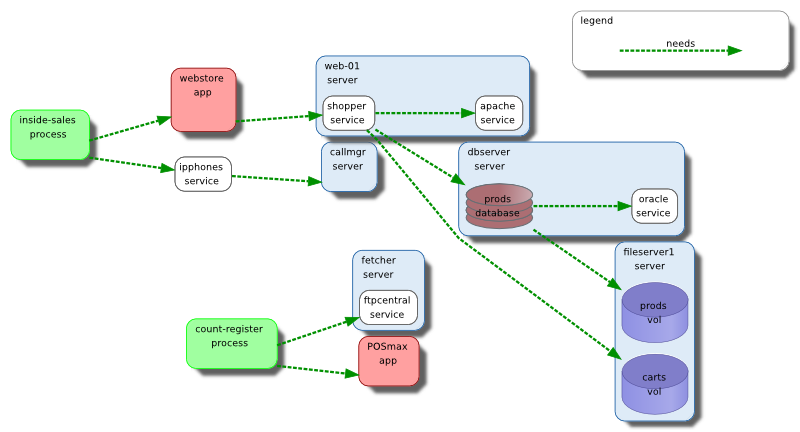
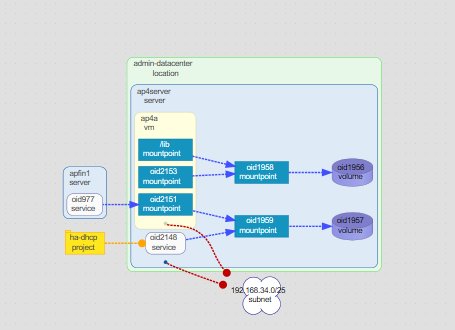
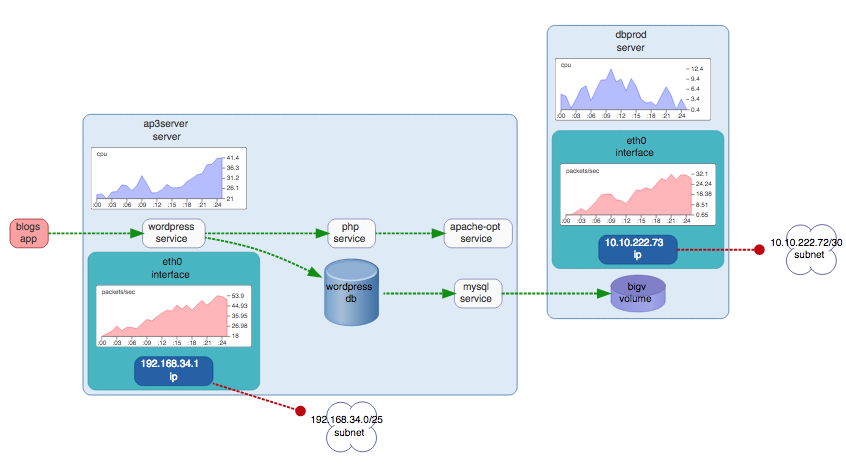
Schematix' approach to synchronization means that, after initial configuration, a single fetch command may be executed regularly, presenting the most up-to-date state for dynamic IaaS systems, such as Azure. Furthermore, after merging the auto-discovered information with the user-curated information within the model, users of Schematix will finally have the tools necessary to gain actual insight into how their Azure equipment interacts with their other systems, and be able to leverage the full range of Schematix features across their entire environment.

NMAP to Schematix Synchronization

By Ryan Redman, Feb 3, 2016

One of the simplest ways to automatically build out IT server infrastructure in your model is by using NMAP to scan a network and cURL to upload that data to Schematix for synchronization.

Schematix can read the xml output from NMAP directly and build the objects and relations discovered. Here's how it works:

  • Run NMAP from a server on your network.
  • Feed the data to a Schematix "Action" using cURL.
  • Login to your model and interact with the results.

To pull this off you'll need both opensource tools nmap and curl on your system. You might already have these, but if you don't you can usually get them using yum, apt-get, or whatever you're using to install software from your normal software repositories.

To execute nmap, do something like:
nmap -A -oX out.xml 192.168.1.0/24

Once that has finished, send the output to Schematix using curl like:
curl -F file=@out.xml 'http://model.pathwaysystems.com/api/v1/action/nmap?api_key=key'

Once you've done this, you'll have server information build automatically in your model like the following:

How Schematix does Integration

By Ryan Redman, April 15, 2014

So you want to integrate?

Our customers are always looking to use the right tool for the job. Specialized tools are often the best at what they do, but they don't try to do everything. That's why integration is so important: it let's you build a super-system by getting all the specialized systems to combine their strengths and work in concert. It's about as easy as it sounds. Hard. Still, integration does work, and when it goes smoothly, it's a beautiful thing.

When building Schematix, we always start with the API to make sure that functionality is able to be integrated with a minimum of effort.

Example: Schematix + Atlassian JIRA

Many of our customers use Atlassian JIRA to help manage projects and track issues, and once they have a Schematix model up and running, one of the first things they look to do is get it talking with their other documentation. Fortunately, it takes almost no effort.

Schematix provides diagrams as a dynamic resource using its API. They aren't images you export, they don't end up in My Documents. This isn't Corel Draw. In Schematix, you specify part of your model using a graph expression, and the system automatically generates a diagram of the objects and relations that match.

As your Schematix model changes, the results of the graph expression may change, and thus the visual diagram will also change. But the system doesn't need you to point and click for it. Once you've told it what you want, you're done. Just use both systems naturally, and the integration takes care of itself.

Sounds good so far? Let's go step-by-step through embedding a Schematix dynamic resource into Atlassian JIRA.

Embed a dynamic diagram using the Schematix API

The JIRA Text Gadget module lets you display HTML in your dashboard, but is disabled by default. Before going any further, you'll need to enable it.

Create a standard HTML <IMG> tag, and then let's specify the Schematix diagram in the src attribute. A quick primer: the /graph service of the Schematix API handles rendering of dynamic resources. You give it a graph expression and a format, and it will return a resource. For example, if we want the object named sally, and all the objects that she needs, our graph expression would be

sally>needs>*

and the corresponding /graph service request would be

example.pathwaysystems.com/graph/sally>needs>*?format=png

Placing this /graph service URI into the src attribute of our <IMG> element will fetch an image from the Schematix API, and complete this integration. When you make changes to the Schematix model, the generated diagram, and hence the image embedded in your JIRA dashboard, will change reflect those changes.

Embed the whole interactive Schematix client

Like in the above example, you'll need the JIRA Text Gadget module, which is disabled by default. Before going any further, you'll need to enable it.

When delivering SaaS applications using a browser, practically anything is possible with an HTML <IFRAME> element. Quite simply, the <IFRAME> let's you embed a website inside a website. Since Schematix is a wholly self-contained web-based application, everything works as expected when you load it in an <IFRAME>.

We're not saying you should, but you can.

Schematix embedded in JIRA using an iframe

Integration is the future

As information tasks become more complicated, the tools we use are going to become more specialized. The ability to integrate and communicate is the key quality that allows specialization to succeed. You want your software stack to be like a team of experts, a well-oiled machine.

The availability and composability of web-based applications has big implications for integration. It's one of the reasons we decided to build Schematix the way we did, and the explosion of distributed web services, REST APIs, and micro-service architecture tells us we aren't the only ones to see the benefits of this approach.

That's why, along with the interactive client, every Schematix model ships with a fully-featured API and set of web services. How will you use them?

Automated dependency mapping of cloud resources and IaaS

By Jason Linehan, April 23, 2013

New techniques using Pathway Systems Schematix and Amazon EC2

Growth of cloud-based IT infrastructure has accelerated in recent years, and the unique capabilities of these platforms continues to drive adoption. Amazon Elastic Compute Cloud (EC2), Google Compute Engine, and Microsoft Windows Azure Services Platform are just a few of the services at the leading edge of these developments. The advantages of cloud services - rapid deployment, dynamic scale, and distributed infrastructure - makes them ideal for building failure-tolerant systems to support critical applications.

Such critical applications require appropriately rigorous documentation, as their integration and maintenance are often highly prioritized. One of the challenges in managing cloud infrastructure is building a seamless and complete picture of these remote resources so that they can be incorporated into the existing context of an organization's information architecture.

This challenge is in two parts. The first is that the resources are not only remote from the maintainer, they may exist in an entirely virtualized environment, spanning many physical locations. The second and greater complication is that the dynamic nature of cloud systems ("elastic," to use the Amazon jargon) means that static documentation of these resources rapidly becomes obsolete. The inevitability of its decay tends to encourage half-hearted documentation, because the maintainers know how it will end, and don't enjoy wasting their time.

Amazon EC2 micro-instance synchronized using Schematix

Amazon EC2 micro-instance automatically synchronized using Schematix

Rapid and constant changes are a feature of the cloud environment, not a bug. The Schematix platform helps to smooth away the challenges, and turn them to the advantage of the maintainer. By interfacing with Amazon Web Services, Schematix can automatically build a dependency map of the resources associated with an Amazon EC2 account. This dependency structure can be continuously synchronized to reflect the reported real-time status of your cloud components, essentially creating the documentation for you. Synchronized remote components such as EC2 resources can be seamlessly integrated with an existing dependency model, and co-exist with hand-maintained objects and relations in the usual way.

Of course, when the environment changes too rapidly, it can become difficult to get a sense of the evolution of the system over time. Maintainers see the latest configuration, and perhaps remember the previous one, but what might have happened in between, when they weren't watching? This is one of the reasons that Schematix maintains a complete history of changes to the model. Maintainers are able to call up the state of the model at any time in the past, or inspect changes over an arbitrary time span. These features apply to any resource in a Schematix model, but are especially suited to automated information, which can change constantly, often in small but crucial ways.

The currents and trends of dynamic deployment and distributed IaaS present real challenges for traditional methods of documentation and maintenance, but the unique architecture of the Schematix platform keeps you comfortably ahead of the curve, providing consistent, rigorous visual documentation that blends automatic and manual knowledge to help chart the changing seas of modern IT.

Dependency Mapping Cloud Resources

By Daniel Evenson, January 30, 2012

Dependency mapping is useful not just for the basic IT configuration items such as servers and services, but for all components supporting your critical IT services.

Here we've modeled some of the dependencies of how we host videos on this blog and the Pathway Systems website.

Application dependency map including non-IT configuration items

Application dependency map including non-IT configuration items

Since video streaming uses a lot of bandwidth, we host our videos using Amazon's S3 cloud based storage service. The videos appear to come from our website, but really they're streamed from Amazon so we don't saturate our network connection with video traffic.

This amalgamation of disparate resources brought together to solve a technical problem is quite common especially for web-based solutions using cloud services. One pitfall however, is that it's easy to lose sight of how this solution is architected.

On the cloud, out of sight is out of mind.

So we must ensure we have this solution documented. On the left, we built a quick dependency map of the major components involved. Folks reviewing this down the road will quickly understand the solution.

Starting at the top of the diagram, we see the website pathwaysystems.com depends upon a service we're calling bulk-hosted-video. It's not an actual service that runs on a server, it's just a conceptual service that conveniently describes the overall service.

Below that, we see bulk-hosted-video needs dir video which is a sub directory of dir pathwaysystems which is hosted by us-east-1c and depends upon the service s3.

We've chosen to abstract Amazon's us-east-1c availability zone as a server since that's sort of how it appears to us as an end user. If we wanted to, we could create specific object types particular to Amazon's nomenclature: AMIs, instances, regions etc... But for now, we'll keep it simple.

The point of this article is to demonstrate how we don't stop modeling the dependencies at the IT boundary. Instead we keep going and include all the big components that could cause this system to fail.

Our ability to use Amazon's cloud resources requires a valid AWS account so we see that dependency too.
A specific of dependency of AWS is that it needs to be funded with money, so we've included the "debits" relationship as a blue dotted line to the credit card that's used for auto-payment and the bank account from which the funds are pulled.

If you've got a business to run, it's nice to be able to call up such a diagram on the fly when you're considering such things as follows:

What service will be impacted if a particular credit card is canceled or expires?

What's impacted if Amazon reports problems with the us-east-1c availability zone?

By modeling more than just IT specific components you can see the bigger picture, and do a better job of managing that service and ultimately your mission.

Application Dependency Mapping

By Daniel Evenson, April 7, 2011

One of the more popular goals of dependency mapping is to map out all your applications' dependencies. I guess they don't call it application dependency mapping for nothing! Certainly that's not the only thing we do with dependency mapping but it's a great place to start.

Why? Because it gives us our first visualization of the complexity of the IT environment we manage. The results can be amazing at first, like a blind man gaining sight for the first time.

See the following set for an example:

pdf 
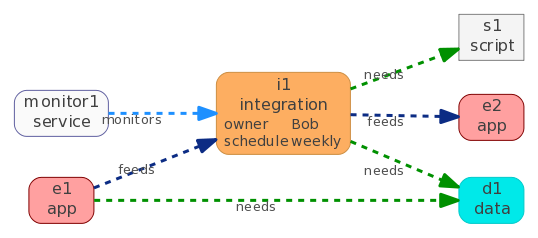
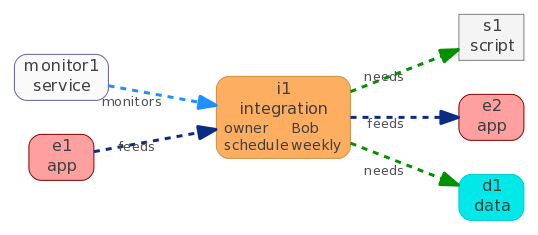
Application Dependency Mapping Schematix

Why do dependency maps shed more light than the typical IT systems or network diagrams we've been using all along? Let's consider that for a moment. What is a typical IT systems diagram? I don't think there is one. I've worked in IT for about 20 years, and still don't understand half the works of art I see. I know I'm not alone. UML (Unified Modeling Language) is an effort to standardize IT modeling babel into a common pictorial language that we can all speak. But it appears to have jumped the shark-it's overkill for most IT folks who are not in large professional development teams.

That's where dependency mapping comes in. It's ridiculously simple, but produces grand results. It's a meta relationship between IT objects.

A needs B.

We don't say why A needs B.

This is the secret to why this works so well; there's danger in getting too detailed with the information you document.

If you want to see the big picture, you must stay high above the landscape.

For example, perhaps your timekeeping app needs database tracker001. Maybe timekeeping writes data there. Maybe it reads data instead. Maybe one object just uses another, or hosts it. There can be many reasons for a dependency but by keeping most of that lower level information out of the dependency map, it keeps our model high-level and consistent. IT configurations are diverse, and difficult to model in part because innovation is constantly changing the archetypes we use to represent our systems.

Fortunately, the notion of dependency between resources is timeless and relevant to everything from people to processes, to hardware and software. Tell me what you rely on, and who relies on you and I'll understand your job, your risks, and how you fit into the big picture, whether you are a person, a database, or a SaaS service.

Model the needs and quickly move on.

As you apply this documentation method across the board, your systems will come into focus. You'll see why some applications (or IT services) fail more than others. Why one costs more, or why one is so hard to shutdown, replace, upgrade, consolidate, explain, etc...

In other words, the visual application dependency map supports much of the routine work we do in IT, whether we're troubleshooting a problem, moving datacenters, funding upgrades, or analyzing impact of natural disaster scenarios.

If the dependency maps are indexed with references to each object in a map, you can use the maps from top-down or bottom-up.

Did you just inherit responsibility to support a legacy app? Refer to the applications dependency map to gauge the work ahead. Planning hardware maintenance on a server? Look up that server in the index, and see what depends upon it. Hurricane expected in Tampa? Look up your dependencies upon Tampa.

The value derived from dependency mapping your IT environment produces immediate visibility and understanding, but the best part is that it pays off over time if you make this sort of meta-documentation a central artifact of your operations. By maintaining and using such models, you re-enforce attention on tracking your resources and their critical dependencies, reducing risks that an obscure dependency will catch you off guard when something fails.

Having worked for years as a Unix consultant, I sure wished more of my customers had dependency maps available before I dove into many uncertain projects booby trapped with dangerous, unseen dependencies. But it was that market need that drove the development of our Schematix product which helps you build and use dependency maps.

No matter how you do it, dependency mapping is a great starting point for gaining control of what you currently manage and establishes effective systems documentation for moving forward.

Dependency Maps are not Dataflow Diagrams

By Daniel Evenson, July 28, 2010

In this post I'd like to go over a point made in a previous post, that dependency maps are not dataflow diagrams.

The most typical IT diagram you find is some variation of the dataflow diagram. How information flows within a system is typically shown with something like the following.

SMTP data flowing between mail servers

SMTP data flowing between mail servers

Here we see data flows as email is delivered. It's routed from the external mail server, through the spam filter, and into the internal mail server. IT staff envision their world like this. Its a conceptual model that facilitates troubleshooting of email problems. But it doesn't clearly show how email services might be impacted by various system failures. By adding dependency relations it will.

Dataflow and Dependencies

Dataflow and Dependencies

We've added a high level object to represent all email service, and also two intermediate objects to distinguish internal functionality from external. We can now see that an external email server failure will impact only external email functionality leaving internal services unaffected. Lose the internal email server however, and both external and internal email functionality is lost.

To simplify the diagram, remove the dataflow information to get the following:

Email Application Dependency Mapping

Email Application Dependency Mapping

Now we have a dependency map of our email service which shows more clearly than a dataflow diagram the result of various system failures. Since a dependency map shows only dependencies, it's a simple diagram that's easy to understand by anyone involved in IT: managers, sysadmins, application specialists and even users. It's not meant to replace the dataflow diagram's use within IT, but to better document IT knowledge to support business continuity and disaster recovery for a broader audience.

Dependency mapping a database backed application

By Daniel Evenson, July 13, 2010

This post explains the proper way to describe the dependencies for a simple database backed application. What better example to use than this very blog!

Here's how we might show the dependencies:

Dependency mapping a database backed application

Dependency mapping a database backed application

In the above diagram, the only relations we show are dependencies (the green dashed line). The service-to-server relation is also shown as a dashed green line. But there's a better way to visualize the hosting dependency, so the following diagram improves the visual aspects of the model by showing all hosting dependencies as one object contained within another. It's the same info, but much more readable.

Dependency mapping database backed application with hosting visualized

Dependency mapping database backed application with hosting visualized

Let's go over why we describe the dependencies like we do. The highest level object in this diagram is the application dependencymapping.com. Here we use the term application to describe a conglomeration of IT components which together provide a very high level service to our users, in this case the blog site itself. We use service objects to describe lower level components which run on physical or virtual servers.

The application dependencymapping.com directly needs 2 things, the Wordpress service and the wp_depmap database. Notice how we don't say Wordpress needs wp_depmap. Even though the two are associated with one another, there's no direct dependency between them. We can conclude that by asking, "If Wordpress failed, would wp_depmap fail?", or the converse. In both cases, the answer is no, neither object would cause a failure of the other, but it would cause the higher level blog application to fail.

Let's take a quick look at how useful this diagram is. As simple as it is, it tells us a lot. We easily see there are two physical servers involved, and one virtual server. Its obvious how complicated this application deployment is (not very). And we can see how a failure of any component, or perhaps botched maintenance like an upgrade could cause an outage. This simple diagram should be readable by both technical and managerial audiences, and can support many important IT operational decisions.

Pitfalls in Dependency Mapping of Business Processes and IT Systems

By Daniel Evenson, July 12, 2010

This is a basic dependency map of a couple of business processes mapped to the supporting IT systems. The dashed green line in the diagram denotes a needs relation between two objects.

Dependency Mapping of Business Process and IT systems

Dependency Mapping of Business Process and IT systems

In this example we see just two business processes, but for a typical company there could be a hundred or more. It can be a big task to accomplish so here's some tips to keep in mind as you get going.

Don't get too detailed early on

A common mistake we see when our customers embark on mapping their dependencies is to put too much information in initially. They get twisted up on the complex details of things such as virtualization, clusters, and load-balanced configurations. In general, research and map out the high level stuff initially, like process to application or application to service. Just like making a geographic map, make the large scale first, then fill in the details later. It takes a bit of experience to know the best way to represent dependencies, and that experience will come the more you do.

Focus on what you know first

Get the hang of modeling dependencies with the information you already have in your head before you get others involved. Odds are you'll revise your own models a few times before you get the hang of it, so it's better not to confuse others as you're learning yourself. Most of our customers come from an IT background and are usually an expert on some applications or systems, and can start there.

BPMN is probably overkill

Business process modeling notation (BPMN) is typically used for detailed modeling of business processes to better study the business for process re-engineering. If you're looking to map dependencies to support impact analysis, or change management, or support business continuity and disaster recovery, you don't need to get as detailed as BPMN would have you do. Sometimes the subject matter experts (SMEs) you speak with will be well versed in BPMN and may have models available. Explain that you're concerned with just the high level dependencies initially and use the BPMN models to identify them.

Beware the data-flow diagrams

Speak with IT centric folks and they'll give you a Vulcan mind-meld of data-flow information, describing the intricate details of how data flows within a system. Like a BPMN model this can make your head spin, but again it provides the basis for much of the dependencies. Use their expertise to distill the critical dependencies, and record them in your model. Use the simple interrogative of "If this were to fail, would it cause that to fail?" It's a simple question that helps identify the existence of a dependency, and its direction.

Integrate with operations like change management or production acceptance

To really benefit from dependency mapping, the knowledge recorded must be published and used for a higher purpose than simply to keep you busy, or scratch someones itch for such a project. The reason for tracking, recording, and publishing dependency information is usually to make to some lasting improvements in systems uptime, maintenance, or recoverability. To do this, dependency knowledge must be available at strategic decision points. The most frequent bang-for-the buck comes from reviewing dependency models during change management and production acceptance meetings. In those meeting, the dependency maps clearly show what might be impacted by changes and who should be involved in approving a change or acceptance request. This regular use of dependency information also reminds participants to contribute to the body of knowledge.